How to create a canvas drawing tool with vanilla JavaScript
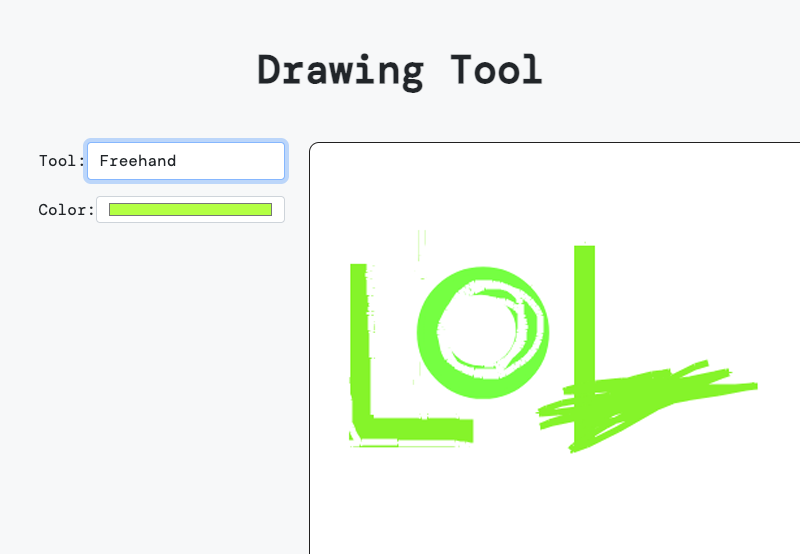
By the end of this tutorial, you will be able to draw different shapes of different colors. Take a look at the final working demo below. Feel free to fork and play around with it!
HTML structure
The HTML Structure will consist of the following components:
Here is the HTML structure (as ever, to simplify the process) using Bootstrap.
1 |
|
2 |
|
3 |
Drawing Tool |
4 |
|
5 |
|
6 |
|
7 |
|
8 |
|
9 |
|
10 |
|
11 |
|
12 |
|
13 |
|
14 |
|
15 |
|
16 |
|
17 |
|
18 |
|
19 |
|
20 |
type="color" id="drawcolor" name="drawcolor" value="#00FFFF" class="form-control" />
|
21 |
|
22 |
|
23 |
|
24 |
|
25 |
|
26 |
|
27 |
|
For the canvas, we are setting a custom width and height with .
The custom setting defines the size and will also ensure that the drawing area is appropriately scaled and allows for precise control over the dimensions of the canvas.
Styling with CSS
Add the following custom styles:
1 |
@import url("https://fonts.googleapis.com/css2?family=DM+Mono:ital,wght@0,300;0,400;0,500;1,300;1,400;1,500&display=swap"); |
2 |
body { |
3 |
background-color: rgb(247, 248, 249); |
4 |
font-family: "DM Mono", monospace; |
5 |
}
|
6 |
canvas { |
7 |
border: 1px solid rgb(33, 32, 32); |
8 |
border-radius: 10px; |
9 |
background-color: #fff; |
10 |
cursor: crosshair; |
11 |
}
|
12 |
h1{ |
13 |
font-weight:600; |
14 |
}
|
The custom styles feature a custom Google font, a border, a border radius to the canvas element, and a white background color.
JavaScript functionality
Start by getting the canvas element
1 |
const canvas = document.querySelector("canvas"); |
Next, create a 2D context object which will allow us to draw in the canvas. The 2D context object contains methods for drawing on the canvas.
1 |
ctx = canvas.getContext("2d", { willReadFrequently: true }); |
Define some initial variables:
1 |
let isDrawing = false; |
2 |
let startX = 0; |
3 |
let startY = 0; |
4 |
let initialImageData; |
-
isDrawing: this variable will keep track of when the canvas is being drawn on. -
startXis the initial point on the X axis on the canvas where any drawing will start. -
startYis the initial point on the y axis on the canvas where any drawing will start. -
initialImageDatais used to keep a copy of how the canvas looked before any drawing begins. It’s also useful for preventing trails when new shapes are drawn.
Add event listeners to get the selected color and tool:
1 |
selectTool = document.getElementById("tool"); |
2 |
|
3 |
let currentTool = selectTool.value; |
4 |
|
5 |
selectedColor = document.getElementById("drawcolor"); |
6 |
let color = selectedColor.value; |
7 |
|
8 |
selectedColor.addEventListener("input", () => { |
9 |
color = selectedColor.value; |
10 |
});
|
11 |
|
12 |
selectTool.addEventListener("change", () => { |
13 |
currentTool = selectTool.value; |
14 |
});
|
Next, add an event listener to the canvas on the mousedown event. The mousedown event will invoke the startDrawing() function.
1 |
canvas.addEventListener("mousedown", startDrawing); |
Create the called startDrawing() function which will look like this:
1 |
function startDrawing(e) { |
2 |
ctx.lineWidth = 5; |
3 |
startX = e.offsetX; |
4 |
startY = e.offsetY; |
5 |
isDrawing = true; |
6 |
ctx.beginPath(); |
7 |
|
8 |
ctx.fillStyle = color; |
9 |
ctx.strokeStyle = color; |
10 |
initialImageData = ctx.getImageData(0, 0, canvas.width, canvas.height); |
11 |
}
|
In the code above, on the mousedown event , we will use the linewidth() method provided by the 2D context object to set a custom size for the drawing line width in pixels.
-
isDrawing = true;sets theIsDrawingvalue to true to signify that the drawing has started. -
startX = e.offsetX; will set the value of startX to the x-coordinate of the mouse pointer. -
startY = e.offsetY;will set the value ofstartYto the y-cordinate of the mouse pointer. -
ctx.beginPath(); beginPath ()is a 2D context method which begins a new path. In this case, a new path will be started at the intersection ofstartXandstartY. -
ctx.fillStyle = color;will set the color used to fill the drawing -
ctx.strokeStyle = color;sets the selected color as the stroke color.
Next, add an event listener to the canvas on the mousemove event. The mousemove event will invoke the Drawing() function.
1 |
canvas.addEventListener("mousemove", drawing); |
When the user moves the mouse, create a function called drawing which will first check for the isDrawing condition, if its not true, the function will exit.
1 |
function drawing(e) { |
2 |
if (!isDrawing) return; |
3 |
}
|
If the isDrawing condition is happening, we will use conditions to check the current selected tool and update appropriately. We will create case switch statements for each of the following tools:
- freehand
- circle
- triangle
- eraser
1 |
function drawing(e) { |
2 |
if (!isDrawing) return; |
3 |
|
4 |
|
5 |
switch (currentTool) { |
6 |
case "freehand": |
7 |
// use freehand tool
|
8 |
break; |
9 |
|
10 |
case "rectangle": |
11 |
// draw rectangle
|
12 |
break; |
13 |
|
14 |
case "circle": |
15 |
// draw circle
|
16 |
break; |
17 |
|
18 |
case "eraser": |
19 |
//erase
|
20 |
break; |
21 |
|
22 |
default: |
23 |
break; |
24 |
}
|
25 |
}
|
For the freehand tool, update the function as shown below:
1 |
function drawing(e) { |
2 |
if (!isDrawing) return; |
3 |
switch (currentTool) { |
4 |
case "freehand": |
5 |
ctx.moveTo(startX, startY); |
6 |
ctx.lineTo(e.offsetX, e.offsetY); |
7 |
ctx.stroke(); |
8 |
startX = e.offsetX; |
9 |
startY = e.offsetY; |
10 |
break; |
11 |
// rest of the code
|
12 |
}}
|
When the freehand tool is selected, we will do the following:
-
ctx.moveTo(startX, startY);will move the drawing cursor to the starting point -
ctx.lineTo(e.offsetX, e.offsetY);will add a line from the starting point to the current mouse position -
ctx.stroke();will draw the line path with the selected color. -
startX = e.offsetX; and startY = e.offsetY;will reset the starting points.
When the rectangle is selected, update the function as follows:
1 |
function drawing(e) { |
2 |
if (!isDrawing) return; |
3 |
ctx.putImageData(initialImageData, 0, 0); |
4 |
|
5 |
switch (currentTool) { |
6 |
case "freehand": |
7 |
ctx.moveTo(startX, startY); |
8 |
ctx.lineTo(e.offsetX, e.offsetY); |
9 |
ctx.stroke(); |
10 |
startX = e.offsetX; |
11 |
startY = e.offsetY; |
12 |
break; |
13 |
|
14 |
case "rectangle": |
15 |
const width = e.offsetX - startX; |
16 |
const height = e.offsetY - startY; |
17 |
ctx.fillRect(startX, startY, width, height); |
18 |
ctx.beginPath(); |
19 |
break; |
20 |
}}
|
-
const width = e.offsetX - startX;The width is obtained by the difference between the start position, represented bystartXand the currrent x-cordinate of the mouse pointer. -
const height = e.offsetY - startY;To get the height, we get the difference between the start position, represented bystartYand the currrent y-cordinate of the mouse pointer. -
ctx.fillRect(startX, startY, width, height);thefillRect()method will draw a filled rectangle. This method takes in parameters in the order provided.
To draw a circle, we first need to get the circle’s radius, we will then use the .arc() method to draw a curve to the specified path. The .arc() method has the following syntax.
1 |
context.arc(x, y, r, startAngle, endAngle, counterclockwise) |
where
xandyare the x and y-coordinate of the center of the circle-
ris the radius of the circle, which is calculated by the distance from the center to any point in the circumference of the circle. To get the radius of the circle, we will use the Pythagoras theorem -
startAngleis the angle at which the path starts, measured in radians. In the context of a circle, this is typically set to 0, indicating the starting point of the path -
endAngleis the angle at which the path ends in radians. It is obtained by2*PI(corresponds to 360 degrees)
Let’s get the radius using the Pythagoras theorem.
1 |
const radius = Math.sqrt( |
2 |
(e.offsetX - startX) ** 2 + (e.offsetY - startY) ** 2 |
3 |
);
|
Now if we substitute our values in the .arc() method, the code for drawing a circle will look like this:
1 |
function drawing(e) { |
2 |
if (!isDrawing) return; |
3 |
ctx.putImageData(initialImageData, 0, 0); |
4 |
|
5 |
switch (currentTool) { |
6 |
case "freehand": |
7 |
ctx.moveTo(startX, startY); |
8 |
ctx.lineTo(e.offsetX, e.offsetY); |
9 |
ctx.stroke(); |
10 |
startX = e.offsetX; |
11 |
startY = e.offsetY; |
12 |
break; |
13 |
|
14 |
case "rectangle": |
15 |
const width = e.offsetX - startX; |
16 |
const height = e.offsetY - startY; |
17 |
ctx.fillRect(startX, startY, width, height); |
18 |
ctx.beginPath(); |
19 |
break; |
20 |
|
21 |
case "circle": |
22 |
const radius = Math.sqrt( |
23 |
(e.offsetX - startX) ** 2 + (e.offsetY - startY) ** 2 |
24 |
);
|
25 |
ctx.beginPath(); |
26 |
ctx.arc(startX, startY, radius, 0, 2 * Math.PI); |
27 |
ctx.fill(); |
28 |
ctx.stroke(); |
29 |
break; |
30 |
|
31 |
|
32 |
}
|
33 |
}
|
Finally, for the eraser tool, update the function as follows:
1 |
function drawing(e) { |
2 |
if (!isDrawing) return; |
3 |
ctx.putImageData(initialImageData, 0, 0); |
4 |
|
5 |
switch (currentTool) { |
6 |
case "freehand": |
7 |
ctx.moveTo(startX, startY); |
8 |
ctx.lineTo(e.offsetX, e.offsetY); |
9 |
ctx.stroke(); |
10 |
startX = e.offsetX; |
11 |
startY = e.offsetY; |
12 |
break; |
13 |
|
14 |
case "rectangle": |
15 |
const width = e.offsetX - startX; |
16 |
const height = e.offsetY - startY; |
17 |
ctx.fillRect(startX, startY, width, height); |
18 |
ctx.beginPath(); |
19 |
break; |
20 |
|
21 |
case "circle": |
22 |
const radius = Math.sqrt( |
23 |
(e.offsetX - startX) ** 2 + (e.offsetY - startY) ** 2 |
24 |
);
|
25 |
ctx.beginPath(); |
26 |
ctx.arc(startX, startY, radius, 0, 2 * Math.PI); |
27 |
ctx.fill(); |
28 |
ctx.stroke(); |
29 |
break; |
30 |
|
31 |
case "eraser": |
32 |
ctx.strokeStyle = "#fff"; |
33 |
ctx.moveTo(startX, startY); |
34 |
ctx.lineTo(e.offsetX, e.offsetY); |
35 |
ctx.stroke(); |
36 |
startX = e.offsetX; |
37 |
startY = e.offsetY; |
38 |
break; |
39 |
|
40 |
default: |
41 |
break; |
42 |
}
|
43 |
}
|
The erase functionality is similar to the freehand tool, except that it uses the color white to cover any previous colors.
The last functionality is the stopDrawing() function which happens on mouseup event which will look like this;
1 |
canvas.addEventListener("mouseup", stopDrawing); |
2 |
function stopDrawing(e) { |
3 |
isDrawing = false; |
4 |
ctx.closePath(); |
5 |
}
|
On the mouseup event, drawing should stop and the current path should be closed. This is to ensure that no further drawing operations occur until a new mousedown event occurs.
The ctx.closePath() method is used to close the current path, ensuring that the shape being drawn is finalized.
Final demo
Let’s remind ourselves what we have built! Here is the demo:
Conclusion
This tutorial has covered how to create a drawing app with Vanilla JavaScript. You can further enhance this app by adding features such as the ability to save drawings, custom brush sizes, different shapes and tools, and so on.


![Discord Bot Hosting: The Complete Infrastructure Guide for Enterprises [2025]](https://payless.host/wp-content/uploads/2025/06/Discord-Bot-Hosting-The-Complete-Infrastructure-Guide-for-Enterprises-2025-60x60.png)