Maximize Your Return on Ad Spend (ROAS)
ROAS (Return on Ad Spend) is a key metric that helps marketers determine the efficacy of their advertising spending and craft effective strategies for better outcomes. Businesses with well-optimized ROAS strategies usually achieve higher profits.
One of the key ways businesses optimize their ROAS is by understanding which social platforms yield the best return on their advertising spending. During a 2023 survey of large business-to-consumer (B2C) advertisers in Canada and the United States. 48% of respondents said YouTube generated the best ROAS for them, followed by Instagram, as shown below:

This comprehensive post explains ROAS in-depth, including its meaning, calculations, benchmarks, impact on technical infrastructure, and strategies for improvement.
Let’s dive in.
What is Return on Ad Spend (ROAS)?
ROAS, in simple terms, measures the profitability of your advertising budgets and how effective an advertising campaign is. You can calculate ROAS per app or per campaign to measure the productivity of your digital advertising investments.
Here is the formula to calculate your ROAS:
ROAS = Total Revenue Generated from Ads ÷ Total Ad Spend
While ROAS is the simplest form of marketing metric, it is also one of the most important metrics in digital advertising.
ROAS vs ROI
ROAS refers to return on ad spend while ROI refers to Return on Investments. While these terms are often used interchangeably, they come with distinct differences.
ROI is a term that considers the total investment cost, such as production cost, ad spend, and other expenses, against the overall profit produced. When calculating ROI, you are aiming to measure the return on a particular investment parallel to the cost of that investment.
ROI is a calculation of your net profit and investment. This would be an ROI formula:
ROI = (Net Profit ÷ Net Investment) x 100
ROAS, on the other hand, specifically focuses on the revenue produced directly from advertising campaigns. The main goal of ROAS is to help marketers and advertisers plan the overall strategy of digital marketing campaigns.
This is achieved by calculating the amount of money generated from the campaign relative to the total amount invested in running the ad campaign.
The table below highlights the key differences between ROI and ROAS.
| Aspect | ROAS (Return on Ad Spend) | ROI (Return on Investment) |
|---|---|---|
| Definition | Measures revenue generated directly from ad campaigns. | Evaluates overall profitability, taking into account all costs. |
| Focus | Advertising efficiency and campaign performance. | Overall financial performance and investment efficiency. |
| Formula | Revenue from Ads ÷ Advertising Cost | (Net Profit ÷ Total Investment Cost) × 100 |
| Scope | Narrow: Focuses only on ad spend and related revenue. | Broad: Considers all expenses like production, salaries, etc. |
| Purpose | Helps marketers adjust campaigns for better ad efficiency. | Assesses overall return relative to total investment cost. |
| Usage | Ideal for real-time, ad-specific decisions. | Best for evaluating long-term business profitability. |
Many advertisers prefer ROAS for campaign optimization because the metric offers a direct and easily measurable indicator of ad campaign performance.
ROAS Benchmarks by Channel
So, now that you have the basics of ROAS down, you may be curious how your tool measures up compared to industry benchmarks. We’ve got you covered!
The following are the industry averages for ROAS, measuring return on ad spend on organic and paid channels, as disclosed by FirstPageSage.
| Organic Channels | ROAS |
|---|---|
| SEO | 9.10 |
| Email Marketing | 3.50 |
| LinkedIn Organic | 2.75 |
| Webinars | 4.95 |
| Paid Channels | ROAS |
|---|---|
| PPC/SEM | 1.55 |
| LinkedIn Ads | 2.30 |
| Facebook Ads | 1.80 |
| Online PR | 1.60 |
| Influencer Marketing | 3.45 |
Calculating Your ROAS: A Step-by-Step Guide
These are essential metrics to calculate the ROAS of your ad campaign.
1. Determine the Exact Total Amount of Your Ad Spend
The total amount of your ad spends includes all costs across each platform you are using to run your ad campaign (e.g., social media ads, Google Ads, and display ads).
2. Track the Ad Revenue Generated Directly From Campaigns
You can use marketing automation tools to track your ad revenue across all your ad platforms. Similarly, incorporating tracking pixels and using e-commerce platforms with built-in analytics are ideal practices for tracking the ad revenue generated directly from ad campaigns.
3. Get the Exact Profit From the Ad Campaign by Division
Return on ad spend of your digital investments is achieved by dividing the total ad revenue generated from the ad campaign by the exact total amount invested in it.
For instance, a company spends $4,000 on a digital marketing campaign in two months, which results in $10,000 of revenue generated. Here is how we will calculate its ROAS:
$10,000 Total Revenue from Ads ÷ $4,000 Total Ad Spend = 2.5 ROAS
So, for this campaign, every dollar spent generates $2.5 worth of revenue.
ROAS Benchmarks: What’s Considered “Good”?
A good ROAS primarily depends on the campaign goals, specific industry, and business objectives. Acquiring industry benchmarks can offer valuable insight to marketers and advertisers.
According to forums of advertisers, a 2-3:1 ROAS is fairly standard, 4:1 being a good ROAS and 5:1 being great.
Industry-Specific Standards
While actual ROAS figures can fluctuate due to unavoidable marketing circumstances, the following illustrates the general observation about ROAS benchmarks across different industries:
- eCommerce: What’s considered “good” ROAS for an eCommerce business ranges from 1.1 to 3 or sometimes higher, depending on the competitive market environment and specific industry.
- B2B Services: In SaaS (Software as a Service), tech and B2B (Business-to-Business) services have varying benchmarks for ROAS. However, a “good” ROAS for B2B services is considered to be 3:1 or higher.
- Retail: The average ROAS of Retail is 2.8:1.
- SaaS: Typically, a “good” ROAS for SaaS falls between 3:1 and 8:1. For every 1 dollar you spend on advertising your SaaS products, you should generate between $3 to $8 in ad revenue.
The table below illustrates “good” target ROAS benchmarks for different industries.
| Industry | Target ROAS Benchmark |
|---|---|
| eCommerce | 1.1:1 to 3:1 or higher, depending on the competition |
| B2B Services | 3:1 or higher |
| Retail | 2.8:1 |
| SaaS | 3:1 to 8:1 |
B2B vs B2C ROAS Standards
B2B, commonly known as (Business-to-Business) and B2C (Business-to-Consumer) industries, vary in their ROAS benchmarks due to their different attributes, including target audiences, sales cycles, and advertising strategies.
Here’s the distinct comparison between B2B vs B2C standards.
| Aspect | B2B | B2C |
|---|---|---|
| Good ROAS Benchmark | 3:1 or higher | 2:1 to 5:1, depending on industry and season |
| Sales Cycle | Longer, often requiring multiple touch points | Shorter, with more impulse-driven decisions |
| Average Purchase Value | Higher, with fewer transactions | Lower, with higher transaction volume |
| Customer Lifetime Value | Crucial for calculating effective ROAS | Important but not as high as B2B |
| Ad Strategy Focus | Lead generation, nurturing, and high-touch ads | Direct conversions and high-volume sales |
Seasonal ROAS Variations by Industry
Several industries experience major seasonal fluctuations, which directly impact their ROAS. For instance:
- Peak Seasons: This includes holidays such as Christmas and Black Fridays. These seasons usually experience a surge in sales, which often results in higher ROAS due to increased consumer purchases. eCommerce businesses during these periods usually experience higher ROAS compared to other industries.
- Off-Seasons: These are periods outside holidays characterized by lower consumer spending, resulting in lower sales and lower ROAS.
- Summer Season: These seasons favor certain industries, such as tourism, travel, and outdoor activities, often leading to a higher demand and ROAS during these months.
Technical Infrastructure’s Impact on ROAS
Website performance plays a pivotal role in maximizing ROAS. Typically, an unreliable and slow website can prevent an ad campaign from performing well and drive customers away, negatively affecting ROAS.
The following are some of the website performing factors you need to put into consideration to maximize your ROAS.
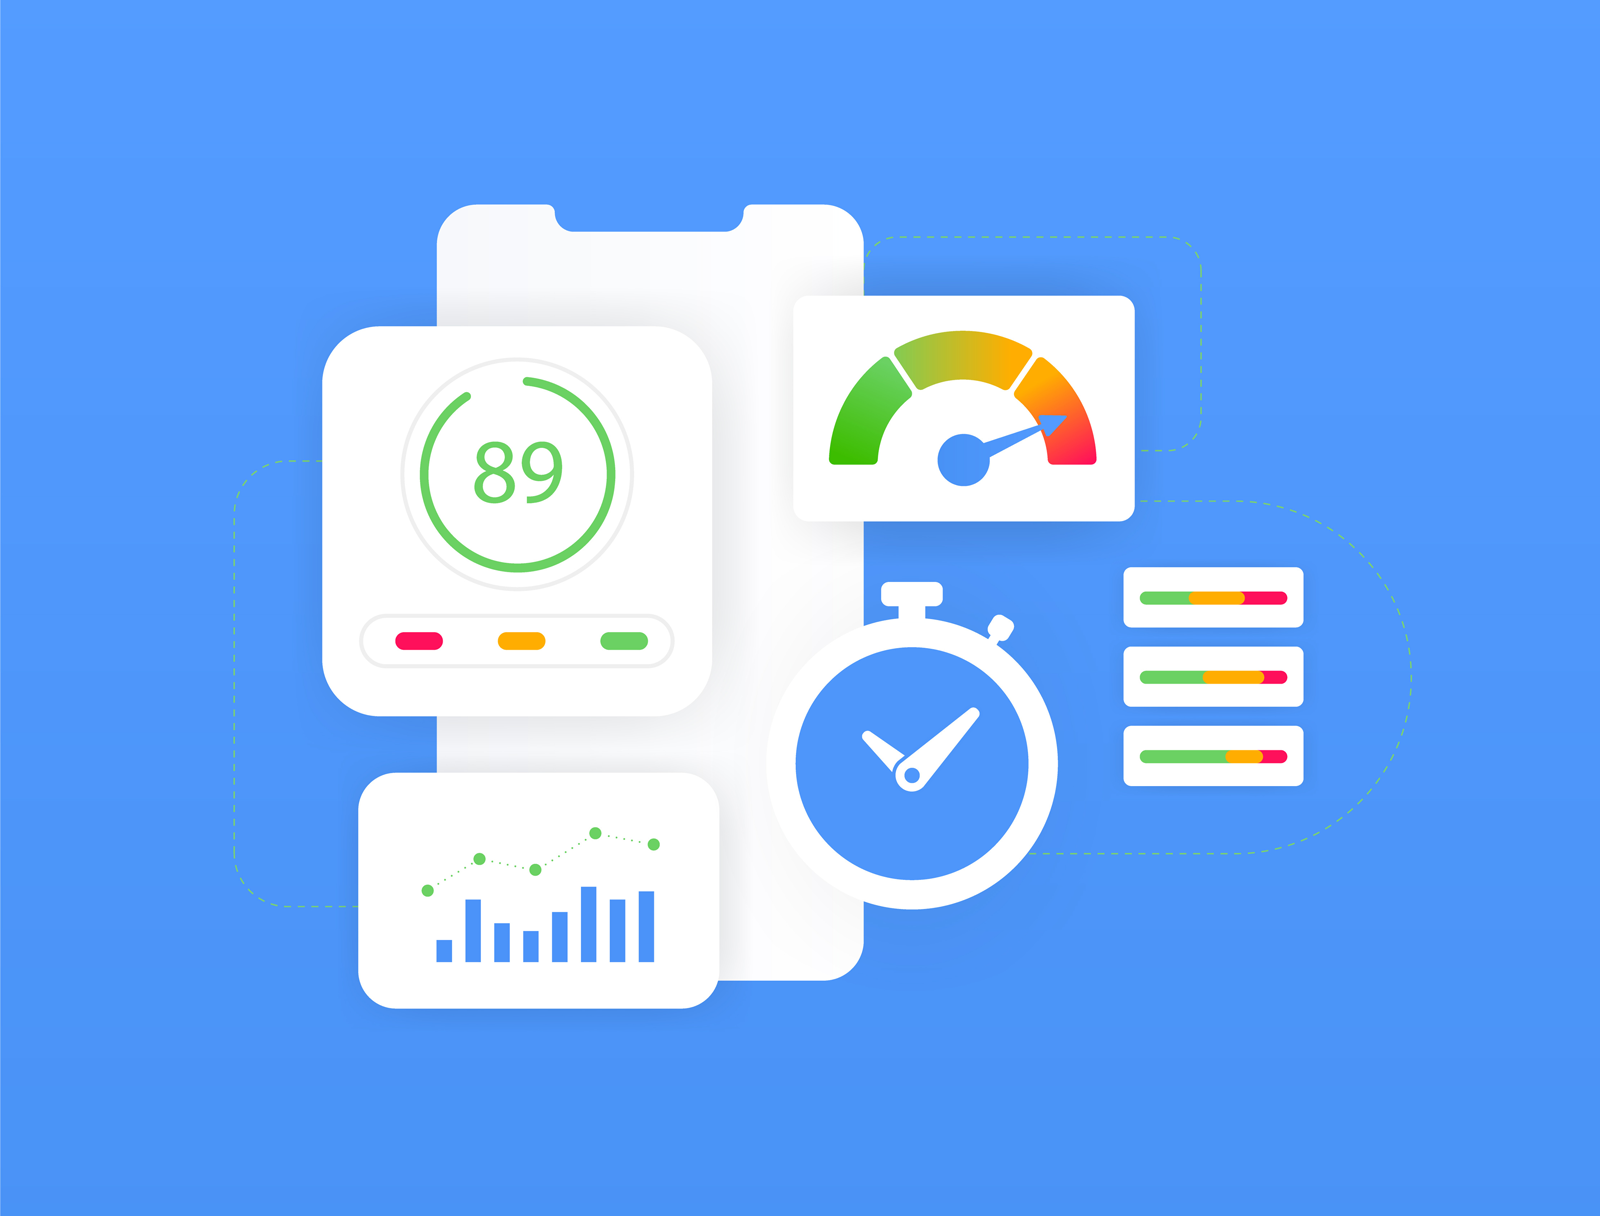
Website Performance Factors
Page Load Speed Impact
User expectations and behaviors have changed in today’s fast-paced world where everyone is competing for your attention. Users expect a website to load quickly and get the information they want without wasting time. However, a slow-loading website can lead to high bounce rates and drive away customers. Good news: Businesses using InMotion Hosting’s business-class servers report faster website loading times under 1.5 seconds.
Server Response Time
The speed at which a server responds to users’ inquiries can impact ROAS. Slow server response times can primarily result in delays in page loading, leading to poor user experience. This can ultimately affect the ROAS.
Hosting Reliability
Generally, unreliable hosting, which leads to frequent slow server performance, can seriously alter website performance. Such pitfalls can damage brand reputation and negatively affect ROAS.
Problems like those mentioned above can severely impact your business ROAS. However, most companies using InMotion Hosting’s dedicated server hosting report up to 20% higher conversion rates due to optimal website performance.
Our exceptional infrastructure ensures fast loading times, an easy user experience, and high uptime, resulting in a higher and more profitable return on your business’s ad spend.
Competitive ROAS Analysis
Competitive ROAS analysis is characterized by benchmarking one’s own performance against that of other industries or competitors. This analysis often offers golden insights into one’s business strengths and weaknesses and helps spot areas for improvement.
Benchmarking Methods
You can either use an indirect or direct comparison method. The indirect comparison method involves analyzing public data, including social media posts, competitors’ sites, and news articles, to gain valuable information about your competitors’ marketing strategies and potential ROAS. The direct benchmarking method, on the other hand, involves accessing your competitors’ data directly through industry reports or comprehensive market research and comparing your ROAS with them.
Tools for Analysis
The following tools for analysis can significantly help you to calculate and analyze your ROAS:
- Marketing analytic platforms, such as Google Analytics
- Advertising platform dashboards include Facebook Ads Manager, Google Ads, and LinkedIn Ads.
- SEMrush and SpyFu can help you collect information on your competitors’ websites, including their social media and advertising campaigns.
Market Share Considerations
A thorough analysis of competitors’ ROAS and their potential strategies helps to spot areas where improved ROAS strategies can boost your marketing strategies. Here is an illustration of a powerful competitive analysis case study and its results.
B2C eCommerce Case Study: Achieving ROAS >$5 in 3 Months
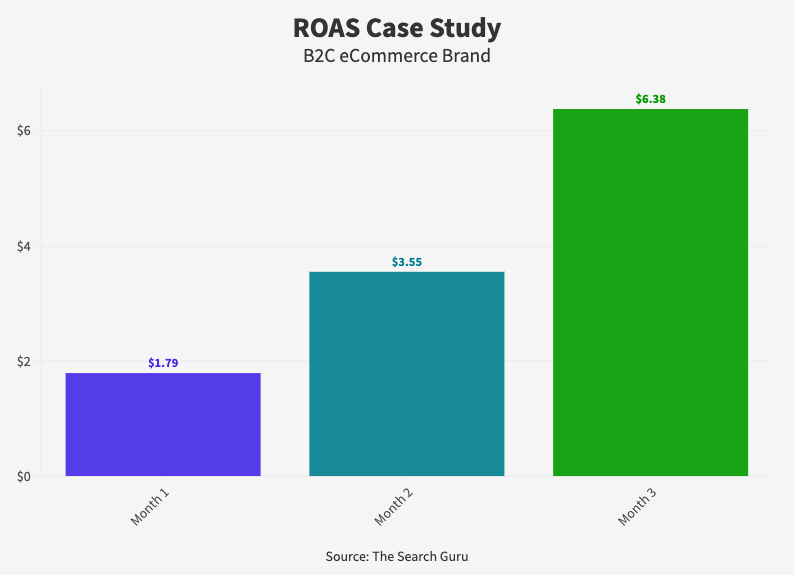
A B2C eCommerce brand selling on eBay and Amazon tested Google Ads to attain the best ROAS. They employed the following strategies to achieve the best results:
Solution:
- Performed market and competitor analysis.
- Set up Google Ads and Merchant Center and optimized Goal and Revenue Tracking.
- Split products into “winners” and “the rest” to focus competitive bidding on top performers.
- Implemented daily account and ad optimizations.
Outcomes:
- Revenue: Increased 13x
- Cost: Increased 3x
- ROAS: Improved by 256.37%
The ad campaign satisfied the client’s objective, enabling unlimited budget allocation for Google Ads and proactive growth.
5 Proven Strategies to Improve Your ROAS
The following are proven strategies you can significantly implement to enhance your return on ad spend and maximize the return on your business ad campaign.
1. Audience Targeting Optimization
Audience targeting optimization is one plan you can implement to improve your business’s ROAS. Using customers’ interests, personas, and behaviors is another surefire way to increase your business’s ad revenue.
Audience targeting can also be achieved by using a lookalike social media audience to reach new customers who possess similar traits to your existing customers. Additionally, you can filter your audience based on their demographics, online behavior, and buying history.
2. Creative Testing and Iteration
Creative testing includes experimenting with different ad copy, calls to action, and visuals to develop the best ROAS strategies. You can also experiment with different ad formats, including video ads, image ads, interactive ads, and carousel ads, to understand which best suits your target audience.
After you have experimented with different ad formats, it is recommended that you track key metrics such as conversion rates, click-through rates, and cost per conversion to spot the top-performing ads and implement them in your advertising investments.
3. Landing Page Conversion Optimization
Optimizing your landing page for an ad campaign ensures traffic lands on targeted pages for conversion. The landing page should load fast to enhance conversion, leading to increased ROAS. Fast-loading WordPress-optimized solutions from InMotion Hosting can help improve conversion rates.
By leveraging InMotion Hosting’s optimized servers and infrastructure, you can ensure your landing pages load quickly, minimizing bounce rates and improving user experience.
Furthermore, strong CTAs, such as “Shop Now” and “Learn More” that use visitors’ common language encourage them to take action.
4. Bid Strategy Refinement
Consider utilizing automated bidding strategies provided by advertising platforms to fully optimize your business bids based on performance and real-time activities. Similarly, if the current bid is not working, adjust your bids based on ad placement performance. This means you stress your budget on top-performing placements where you can adjust your bid.
5. Budget Allocation Optimization
Budget allocation optimization is another effective strategy for improving ROAS. Therefore, for maximum ROAS, redistribute your ad budget toward campaigns with the best ROAS. If the ROAS is high, allocate more budget to it and pause low-performing ad campaigns.
Regularly analyze campaign performance and adjust budget allocations accordingly to maximize overall ROI. Consider using data-driven attribution models to understand each campaign’s and channel’s true impact on conversions.
Advanced ROAS Optimization Techniques
To further improve your ROAS optimization techniques, implement the following advanced techniques:
1. Attribution Modeling
Understanding attribution modeling in the customer journey ensures accurate and better ROAS attribution. You can primarily use data-driven attribution by utilizing machine learning to analyze customer behavior and relegate credit to each touchpoint based on its contribution to the conversion.
2. Cross-Device Attribution Impact
This involves tracking users across different devices to allocate ad spending better. Often, customers interact with various brands across several devices, such as tablets, smartphones, and desktops. Therefore, cross-device attribution models are essentially used to track the customer journey across devices to measure the impact of ad campaigns accurately.
3. View-Through Conversion Considerations
This happens when a customer converts after seeing an ad but not clicking it directly. Typically, this view-through conversion is challenging to track but can influence the overall campaign performance of the ad.
4. Customer Lifetime Value Consideration
While prompt ROAS is crucial in a business, you must focus on long-term value in customer relationships. Therefore, optimize campaigns to attract and retain potential customers who generate long-term revenue.
5. Analytics Integration Best Practices
Integrating your advertising platforms with Google Analytics, Google Ads, and other website analytics tools is an ideal advanced strategy to improve ROAS. These tools ensure accurate event tracking and precise conversion to help measure ad campaign performance.
6. Infrastructure Requirements
Having strong infrastructure to support the traffic brought in by these ad campaigns is pivotal to your success. InMotion Hosting’s scalable solutions are designed to maintain performance even during high-traffic ad campaigns. Our robust infrastructure ensures your website can handle increased traffic and deliver a seamless user experience, maximizing the impact of your ad spend.
Common ROAS Pitfalls and How to Avoid Them
You can encounter ROAS pitfalls even with careful optimization and strategies. These pitfalls can sometimes hinder your company’s efforts to maximize ROAS. Therefore, by understanding and avoiding these common mistakes, you can maximize the efficacy of your ad spend.
Here are the common ROAS pitfalls and how to avoid them.
- Incomplete Tracking Setup: Ensure tracking pixels and analytics tools are in order and configured completely.
- Ignoring Assisted Conversions: Measure ROAS across all touch points but not just last-click conversions.
- Short-Term Focus: Evaluate ROAS over longer periods to account for customer lifetime value.
- Infrastructure Limitations: Prevent slow-loading pages and downtime with InMotion Hosting’s reliable web hosting solutions.
Getting Started: Your ROAS Action Plan
To get started with your ROAS strategy, follow these steps.
Step-by-Step Implementation Checklist
- Define your campaign goals and metrics.
- Set up tracking tools (e.g., Google Analytics) and advertising pixels.
- Track your own benchmarks against industry standards.
- Test and refine ad creatives and audience targeting.
- Optimize landing pages with fast, reliable hosting.
Recommended Tools and Resources
- Google Ads & Ads Manager
- Google Analytics
- Facebook Ads Manager
- SEMrush, SimilarWeb, SpyFu
Key Milestones and Metrics to Track
- Monthly ROAS Targets
- Conversion Rates (CVR)
- Customer Acquisition Cost (CAC)
- Customer Lifetime Value (CLTV)
Technical Infrastructure Assessment
Ensure your hosting plan can handle increased traffic spikes. InMotion Hosting offers scalable, optimized web hosting solutions tailored to businesses with high-performance needs.
Conclusion: Optimize Your Business ROAS (Return on Ad Spend)
Optimizing your business’s ROAS is pivotal for maximizing advertising investments. Therefore, having an accurate ROAS, setting industry-specific benchmarks, and restructuring your ad campaigns can boost ROAS and its performance. Our reliable hosting can help your business achieve good ROAS by ensuring your technical infrastructure supports your advertising goals.


![Discord Bot Hosting: The Complete Infrastructure Guide for Enterprises [2025]](https://payless.host/wp-content/uploads/2025/06/Discord-Bot-Hosting-The-Complete-Infrastructure-Guide-for-Enterprises-2025-60x60.png)